Description
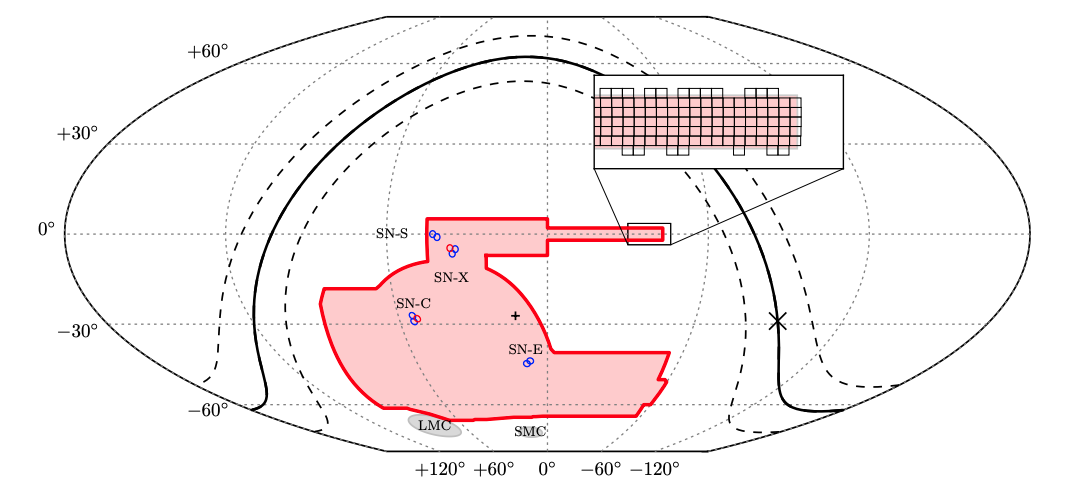
The Dark Energy Survey (DES) is a 5000 square degree survey of the Southern sky in grizY aimed at understanding the accelerating expansion of the Universe and the nature of dark energy. DES uses four complementary measurements to probe the evolution of the Universe: weak gravitational lensing, galaxy cluster counts, the large-scale clustering of galaxies (including baryon acoustic oscillations), and the distances to type Ia supernovae. DES uses the Dark Energy Camera (DECam), a 570 Megapixel CCD imaging camera with a 3 square degree field of view installed at the prime focus of on the Blanco 4m telescope at the Cerro Tololo Interamerican Observatory in northern Chile. DES observed for a period of six years (2013-2019), and has collected information from roughly 550 million distant galaxies and 150 million Milky Way stars. DES has also performed a 27 square degree time domain survey aimed at discovering thousands of supernova and other transients. The DES webpage contains a full description of the survey.
The Dark Energy Survey is releasing the final catalog of precise measurements of galaxies and stars within the DES 5,000-square-degree footprint in the South Galactic Cap. The Y6 Gold catalog is derived from Data Release 2 and includes all six years of g,r,i,z,Y imaging measurements. Y6 Gold was formulated for the DES final cosmological analyses, but it has very general applicability. Compared to the previous Y3 Gold catalog, the depth, star/galaxy classification, photometric precision, and photometric uniformity are all substantially improved. Y6 Gold contains 669 million objects to i ~ 23.4 (S/N = 10 for extended objects).
The des_dr2.main table and des_dr1.main table have been crossmatched against our default reference datasets within a 1.5 arcsec radius, nearest neighbor only. These tables will appear with x1p5 in their name in our table browser. Example: des_dr2.x1p5__main__gaia_dr3__gaia_source.
 DES survey footprint from DES Collaboration (2021).
Goals
- Supernovae. DES observes a 27 square degree area, distributed over several fields, with a weekly cadence aimed at discovering thousands of supernovae for use for cosmology.
- Weak gravitational lensing. DES measures the total matter content and structure of the Universe via the weak gravitational lensing of distant galaxies.
- Galaxy clusters. DES detects tens of thousands of galaxy clusters, the most massive gravitationally bound systems in the Universe.
- Galaxy clustering. DES measures the spatial distribuiton of galaxies which is a sensitive probe of large-scale structure and the primordial distribution of matter.
Back to Top
Data Releases
DES DR2
Documentation for DES DR2 can be found in DES Collaboration (2021).
| DES DR2 Summary | |
|---|---|
| Area covered | ~5000 deg2 |
| Bands | grizY |
| Median catalog depth for 1.95 arcsec diameter aperture at S/N~10 in grizY | 24.7, 24.4, 23.8, 23.1, 21.7 mag |
| Median PSF FWHM in grizY | 1.11, 0.95, 0.88, 0.83, 0.90 arcsec |
| Median astrometric internal precision | ~27 mas |
| Number of co-added image tiles / exposures | 10,169 / 96,263 |
| Number of objects / galaxies / stellar sources | 691,483,608 / 543 million / 145 million |
| DES DR2 Tables | |
| Table Name | Description |
| coverage | Coverage table; fraction of the Healpix 4096 (Nest) pixel covered by a certain band (values between 0 and 1) |
| flux | Object flux table |
| mag | Object magnitude table |
| main | Main photometry; summary table |
| DES Y6 Gold | |
| Table Name | Description |
| y6_gold | Dark Energy Survey Year 6 Gold catalog |
DES DR1
Documentation on DES DR1 can be found in DES Collaboration (2018).
| DES DR1 Summary | |
|---|---|
| Area covered | ~5000 deg2 |
| Bands | grizY |
| Median catalog depth for 1.95 arcsec diameter aperture at S/N~10 in grizY | 24.45, 24.3, 23.5, 22.90, 21.70 mag |
| Median PSF FWHM in grizY | 1.12, 0.96, 0.88, 0.84, 0.90 arcsec |
| Median astrometric internal precision | ~30 mas |
| Number of co-added image tiles | 10,338 |
| Number of objects / galaxies / stellar sources | 399,263,026 / 310 million / 80 million |
| DES DR1 Tables | |
| Table Name | Description |
| des_galex | GALEX (AIS) 1-arcsec crossmatch v. DES DR1 |
| des_hsc2 | HSC2 1-arcsec crossmatch v. DES DR1 |
| des_simbad | SIMBAD 1-arcsec crossmatch v. DES DR1 |
| flux | Object flux table |
| galaxies | Galaxies in DES DR1 |
| img2coadd | Images contributing to coadded tiles |
| mag | Object magnitude table |
| main | Main object summary table |
| tile_info | Tile information table |
| DES DR1 Value-Added Catalogs | |
| Table Name | Description |
| baosample | DES_Y1A1_LSSBAO_v1.1_CATALOG.fits. Main BAO sample catalog detailed in Crocce et al. (2018) |
| im3shape | Galaxy shape catalogues using a maximum-likelihood bulge/disc model calibrated using simulations, applied to r-band data, yielding 21.9M objects |
| mock | Galaxy mock catalogues of the Baryonic Acoustic Oscillation (BAO) angular distance using only photometry (for details, see https://ui.adsabs.harvard.edu/abs/2018MNRAS.479...94A/abstract) |
| mof | Multi-Object Fitting (MOF) Catalogs (for details, see https://des.ncsa.illinois.edu/releases/y1a1/key-catalogs/key-mof) |
| morph | Morphology Catalog (for details, see https://des.ncsa.illinois.edu/releases/y1a1/gold/morphology) |
| photo_z | Photometric redshifts catalog (for details, see https://des.ncsa.illinois.edu/releases/y1a1/key-catalogs/key-photoz) |
| psf | Point spread function catalog (for details, see https://des.ncsa.illinois.edu/releases/y1a1/key-catalogs/key-psf) |
| sgsep_cosmos_tests_v2 | Star-galaxy separation catalog, covering DES observations from the Science Verification period and other DECam observations over the COSMOS field (for more details, see https://des.ncsa.illinois.edu/releases/y1a1/gold/classification) |
| sgsep_hsc_tests_v2 | Star-galaxy separation catalog, covering DES observations from the Science Verification period over two specific fields with Hubble Space Telescope observations (downloaded from the https://archive.stsci.edu/hst/hsc/ site) with the ACS camera (other than COSMOS) appropriate for star-galaxy separation tests (for more details, see https://des.ncsa.illinois.edu/releases/y1a1/gold/classification) |
| sgsep_stripe82_tests_v2 | Star-galaxy separation catalog, covering stripe 82 observations from SDSS with DES Y1 data (for more details, see https://des.ncsa.illinois.edu/releases/y1a1/gold/classification) |
| sgsep_validation_masked_v3 | Star-galaxy separation catalog, covering This file covers observations in the main Y1 footprint with selected columns from Gold, MOF, photo-z and star-galaxy classifiers (for more details, see https://des.ncsa.illinois.edu/releases/y1a1/gold/classification) |
| sgsep_vvds_tests_v2 | Star-galaxy separation catalog, voering VVDS observations with DES from the Science Verification period (for more details, see https://des.ncsa.illinois.edu/releases/y1a1/gold/classification) |
| shape_metacal_flux_griz | Galaxy shape catalogues using a Gaussian model with an innovative internal calibration scheme, applied to riz-bands, yielding 34.8M objects |
| shape_metacal_riz_unblind | Galaxy shape catalogues using a Gaussian model with an innovative internal calibration scheme, applied to riz-bands, yielding 34.8M objects |
| DES Y3 cosmology Value-Added Catalogs | |
| Table Name | Description |
| y3_gold | Dark Energy Survey Year 3 - Cosmology Photometric Data Set |
| y3_gold_footprint | Dark Energy Survey Year 3 - Cosmology Photometric Data Set, Foot Print |
| y3_gold_surveyconditions | Dark Energy Survey Year 3 - Cosmology Photometric Data Set, Survey Conditions |
DES SVA1
For a full description of DES SVA1, visit the DESDM page at NCSA (https://opensource.ncsa.illinois.edu/confluence/display/DESDM/DES+SVA1+Data+Products).
| DES SVA1 Tables | |
|---|---|
| Table Name | Description |
| gold_annz2_pdf | The PDFs have the following binning in redshift: z_min = 0.00, z_max = 1.8, nbins = 180 |
| gold_annz2_point | The structure of the point estimate files are identical. They each contain two columns: the SVA1 unique object identifier and the mean photo-z for that object. |
| gold_bpz_pdf | The PDFs have the following binning in redshift: z_min = 0.005, z_max = 2.505 , nbins = 250 |
| gold_bpz_point | The structure of the point estimate files are identical. They each contain two columns: the SVA1 unique object identifier and the mean photo-z for that object. |
| gold_catalog | The SVA1 GOLD catalog consists of basic astrometry, photometry, and object classification for 25,227,559 objects. |
| gold_im3shape | This catalog includes the shear estimates made using the Im3Shape algorithm, described in Section 7.3 of Jarvis et al, 2015. |
| gold_ngmix | This catalog includes the shear estimates made using the NGMix algorithm, described in Section 7.4 of Jarvis et al, 2015. |
| gold_skynet_pdf | The PDFs have the following binning in redshift: z_min = 0.005, z_max = 1.8, nbins = 200 |
| gold_skynet_point | The structure of the point estimate files are identical. They each contain two columns: the SVA1 unique object identifier and the mean photo-z for that object. |
| gold_tpz_pdf | The PDFs have the following binning in redshift: z_min = 0.0012625, z_max = 1.9962625, nbins = 200 |
| gold_tpz_point | The structure of the point estimate files are identical. They each contain two columns: the SVA1 unique object identifier and the mean photo-z for that object. |
| gold_wlinfo | This catalog is merely for convenience, containing only information derived from other SVA1 catalogs. |
| redmagic_bright | redMaGiC red galaxy catalog; bright redMaGiC samples. See Rozo et al. (2015), Table B2. |
| redmagic_faint | redMaGiC red galaxy catalog; faint redMaGiC samples. See Rozo et al. (2015), Table B2. |
| redmapper_exp_area | The RedMaPPer expanded catalog. Effective Area. See Rykoff et al. (2016), Table 12. |
| redmapper_exp_catalog | The RedMaPPer expanded catalog. Cluster Catalog. See Rykoff et al. (2016), Table 8. |
| redmapper_exp_members | The RedMaPPer expanded catalog. Member Catalog. See Rykoff et al. (2016), Table 9. |
| redmapper_exp_randoms | The RedMaPPer expanded catalog. Random Point. See Rykoff et al. (2016), Table 11. |
| redmapper_exp_zmask | The RedMaPPer expanded catalog. Zmask. See Rykoff et al. (2016), Table 10. |
| redmapper_pub_area | The fiducial catalog with a more conservative footprint and star/galaxy separation. Effective Area. See Rykoff et al. (2016), Table 12. |
| redmapper_pub_catalog | The fiducial catalog with a more conservative footprint and star/galaxy separation. Cluster Catalog. See Rykoff et al. (2016), Table 8. |
| redmapper_pub_members | The fiducial catalog with a more conservative footprint and star/galaxy separation. Member Catalog. See Rykoff et al. (2016), Table 9. |
| redmapper_pub_randoms | The fiducial catalog with a more conservative footprint and star/galaxy separation. Random Point. See Rykoff et al. (2016), Table 11. |
| redmapper_pub_zmask | The fiducial catalog with a more conservative footprint and star/galaxy separation. Zmask. See Rykoff et al. (2016), Table 10. |
To view the schema of any of these tables, use the Query Tool.
Back to Top
Data Reduction
Back to Top


